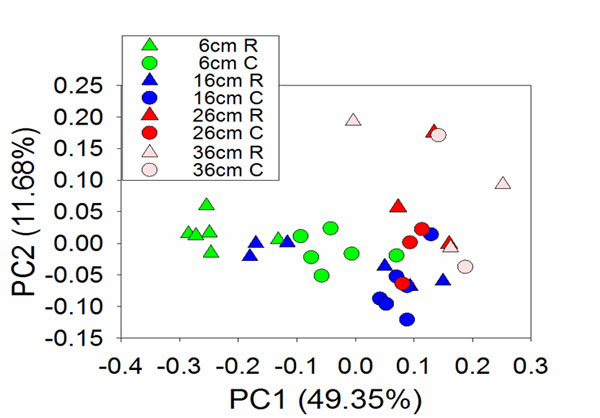
In collaboration with Janet Jansson (now with PNNL), we published this study in Environmental Microbiology Reports, showing that redox gradients are a dominant force in structuring microbial communities in wet Arctic tundra soils.


In collaboration with Janet Jansson (now with PNNL), we published this study in Environmental Microbiology Reports, showing that redox gradients are a dominant force in structuring microbial communities in wet Arctic tundra soils.